If you have ever developed an Office Add-in with Visual Studio you are familiar with pressing F5 to run your Office Add-in and debug the code in it. When you take this approach Visual Studio opens the Office client program associated with your Office Add-in and automatically loads your Add-in into the Office client program. Then, all you do is set breakpoints in your code and debug your code. Easy peasy, as my son would say.
But what about if you don’t have Visual Studio installed? How can you debug the Office Add-in?
You first option is to load the Office Add-in in an Office web client and use F12 to debug it from Internet Explorer, or to use the debugger that comes with other web browsers. This works, but it does have a couple of downsides, such as:
– You might need to debug the Office client application on the PC because you are targeting specific versions of Office clients on the PC.
– You might observe the Office Add-in behaving differently in an Office client application versus an Office web client.
The other option is one I learned from Rolando Jimenez Salgado at the Microsoft MVP Summit last week. I just tried this option out and it works AWESOME. So awesome that I thought I should quickly write up how to do it and share it with all the Office developers on our wonderful planet.
1. First, fire up an Office client application on your PC. In this example I am using Excel.
2. Next, on the Insert tab in the Ribbon, click the Add-ins button and load an Add-in from the Store or your Add-in Catalog.
Image may be NSFW.
Clik here to view.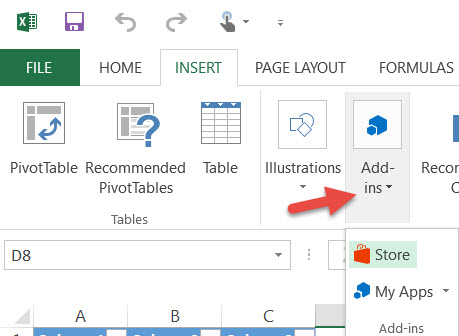
3. In this example I clicked the Store button and the first Add-in I saw in the list was one written by Rolando himself, so I loaded it.
Image may be NSFW.
Clik here to view.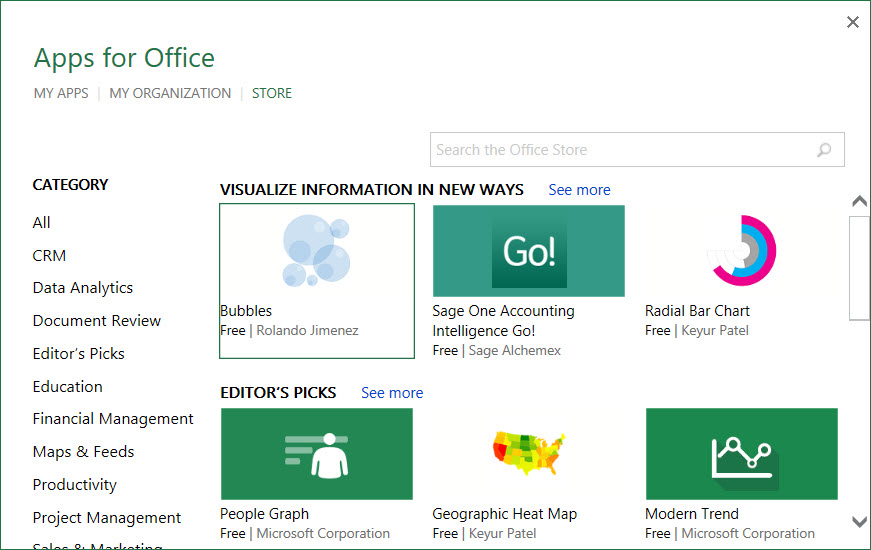
4. Next, open the F12Chooser application that comes with Windows. There are two versions of this application. Use the version of the F12Chooser that matches the version of the Office client application you are running.
32-Bit – C:\Windows\System32\F12\F12Chooser.exe
64-Bit – C:\Windows\SysWOW64\F12\F12Chooser.exe
5. In this example, I am running the 32-Bit version of Office 2013 Professional Plus, so I ran C:\Windows\System32\F12\F12Chooser.exe.
6. After you open the F12 Chooser program, select the application that you would like to debug. In this example, I chose the bubbles.azurewebsites.net web site where the Bubbles Office Add-in (that Rolando wrote) runs. If you are writing your own Office Add-in then select the web site that correlates to where you have the Add-in deployed. This could be a localhost URL.
Image may be NSFW.
Clik here to view.
7. As soon as you click the target to debug, the F12 debugger loads. Here you can see the F12 Debugging application loaded and attached to the Bubbles Office Add-in.
Image may be NSFW.
Clik here to view.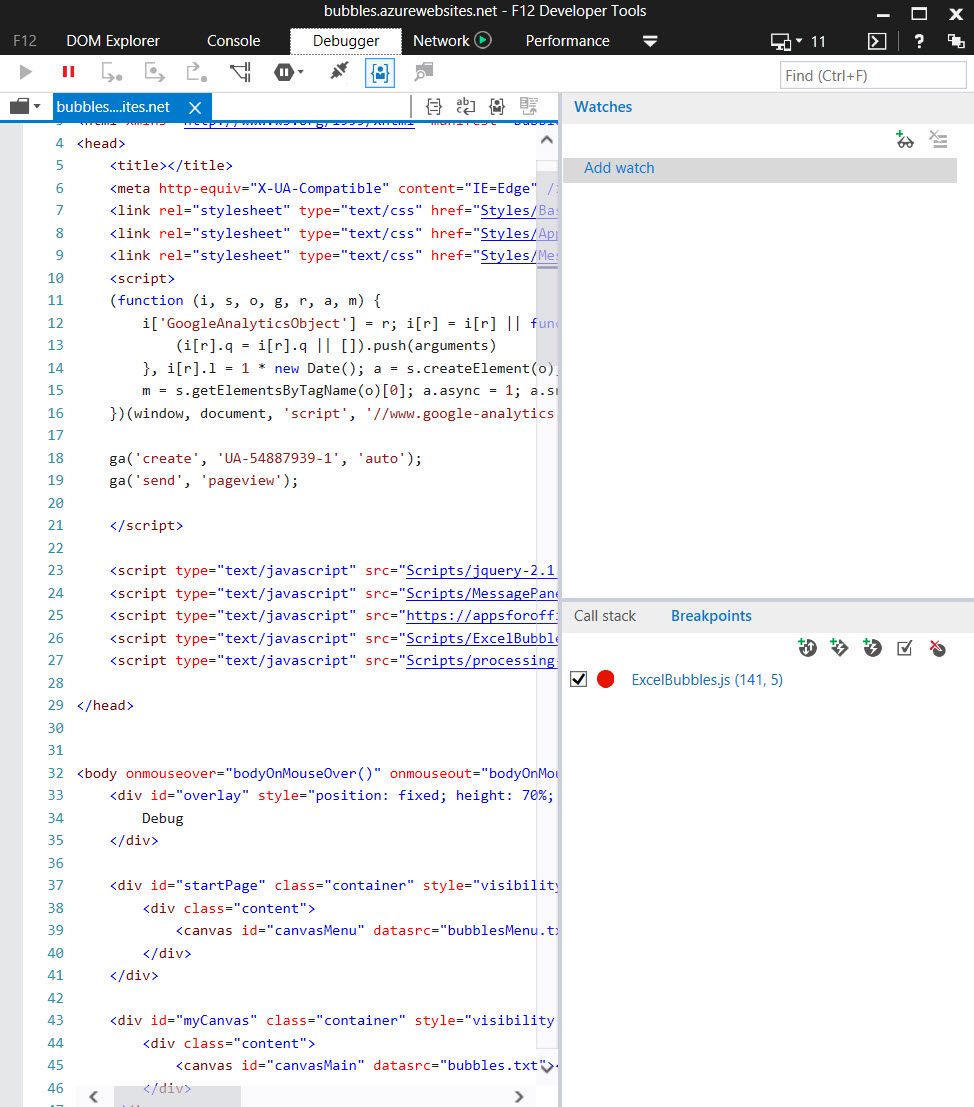
8. To test it out, I created a Data Table in my Excel document, then set a breakpoint in the ExcelBubbles.js file that is part of the Bubbles Add-in. Then I clicked the bubble that says Select Table and the breakpoint I set in ExcelBubbles.js was hit.
Image may be NSFW.
Clik here to view.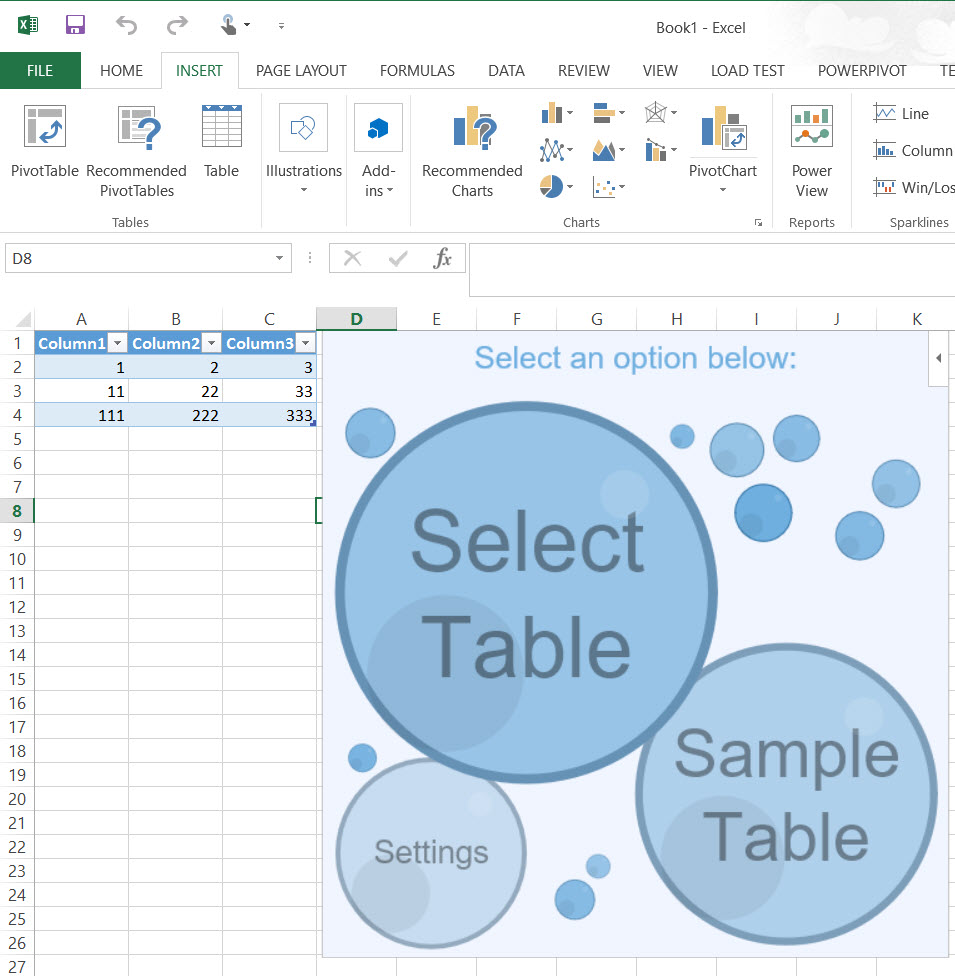
Image may be NSFW.
Clik here to view.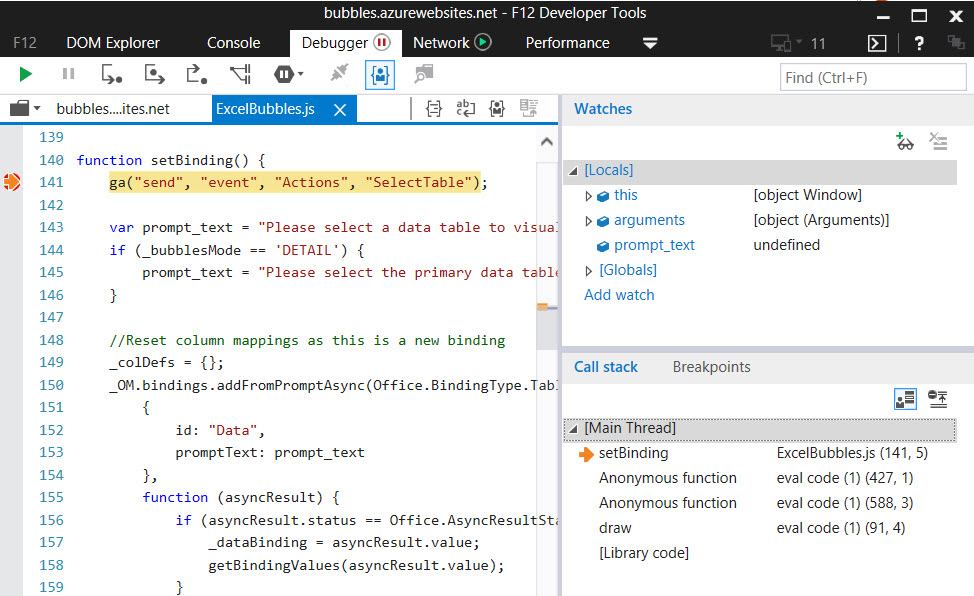
Perfect!
Thanks, Rolando!
Here is a link where you can learn more about the F12Chooser app. http://blogs.msdn.com/b/prakashpatel/archive/2015/11/05/vs2015-remote-debugging-javascript-part-3-f12chooser.aspx